[cross-reference to target(s) "ccog-domain-and-range" missing or not unique]
A function is a process for turning input values into output values. Occasionally a function \(f\) will have input values for which the process breaks down.
Figure11.2.1.Alternative Video Lesson
Subsection11.2.1Domain
Example11.2.2.
Let \(P\) be the population of Portland as a function of the year. According to Google 1
which tells us that a \(50\)- kg person weighs 110 lb, and an \(80\)- kg person weighs 176 lb.
What if we asked for \(w(-100)\text{?}\) In the context of this example, we would be asking for the weight of a person whose mass is -100 kg. This is clearly nonsense. That means that \(w(-100)\) is undefined. Note that the context of the example is telling us that \(w(-100)\) is undefined even though the formula alone might suggest that \(w(-100)=-220\text{.}\)
The domain of \(P\) is all years starting from 1851 and later. It would also be reasonable to say that the domain is actually all years from 1851 up to the current year, since we cannot guarantee that Portland will exist forever.
The domain of \(w\) is all positive real numbers. It is nonsensical to have a person with negative mass or even one with zero mass. While there is some lower bound for the smallest mass a person could have, and also an upper bound for the largest mass a person could have, these boundaries are gray. We can say for sure that non-positive numbers should never be used as inputs for \(w\text{.}\)
The domain of \(g\) is all real numbers except \(7\text{.}\) This is the only number that causes a breakdown in \(g\)’s formula.
Subsection11.2.2Interval, Set, and Set-Builder Notation
Communicating the domain of a function can be wordy. In mathematics, we can communicate the same information using concise notation that is accepted for use almost everywhere. Table 8 contains example functions from this section and their domains, and demonstrates interval notation for these domains. Basic interval notation is covered in Section 1.3, but some of our examples here go beyond what that section covers.
Again, basic interval notation is covered in Section 1.3, but one thing appears in Table 8 that is not explained in that earlier section: the \(\cup\) symbol, which we see in the domain of \(g\text{.}\)
Occasionally there is a need to consider number line pictures such as Figure 9, where two or more intervals appear.
Figure11.2.9.A number line with a union of two intervals
This picture is trying to tell you to consider numbers that are between \(-5\) and \(1\text{,}\) together with numbers that are between \(4\) and \(7\text{.}\) That word “together” is related to the word “union,” and in math the union symbol, \(\cup\text{,}\) captures this idea. It means to combine two ideas together, even if they are separate ideas. Think of it as putting everything from two baskets into one basket: a basket of oranges and a basket of apples combined into one big basket still contains oranges and apples, but now it can be thought of as a single idea. So we can write the numbers in this picture as
\begin{equation*}
[-5,1]\cup(4,7]
\end{equation*}
(which uses interval notation).
With the domain of \(g\) in Table 8, the number line picture shows us another “union” of two intervals. They are very close together, but there are still two separated intervals in that picture: \((-\infty,7)\) and \((7,\infty)\text{.}\) Their union is represented by \((-\infty,7)\cup(7,\infty)\text{.}\)
Checkpoint11.2.10.
What is the domain of the function \(\operatorname{sqrt}\text{,}\) where \(\operatorname{sqrt}(x)=\sqrt{x}\text{,}\) using interval notation?
Explanation.
The function \(\operatorname{sqrt}\) cannot take a negative number as an input. It can however take any positive number as input, or the number \(0\) as input. Representing this on a number line, we find the domain is \([0,\infty)\) in interval notation.
Checkpoint11.2.11.
What is the domain of the function \(\ell\) where \(\ell(x)=\frac{2}{x-3}\text{,}\) using interval notation?
Explanation.
The function \(\ell\) cannot take a \(3\) as an input. It can however take any other number as input. Representing this on a number line, we have an interval \((-\infty,3)\) to the left of \(3\text{,}\) and \((3,\infty)\) to the right of \(3\text{.}\) So we find the domain is \((-\infty,3)\cup(3,\infty)\text{.}\)
Sometimes we will consider collections of only a short list of numbers. In those cases, we use set notation (first introduced in [cross-reference to target(s) "section-set-notation-and-types-of-numbers" missing or not unique]). With set notation, we have a list of numbers in mind, and we simply list all of those numbers. Curly braces are standard for surrounding the list. Table 12 illustrates set notation in use.
Picture of Set
Set Notation
\(\{-2,3\}\)
\(\{-5,1,3,5\}\)
\(\{-2\}\cup(5,\infty)\)
Figure11.2.12.Set Notation
Checkpoint11.2.13.
A change machine lets you put in an \(x\)-dollar bill, and gives you \(f(x)\) nickels in return equal in value to \(x\) dollars. Any current, legal denomination of US paper money can be fed to the change machine. What is the domain of \(f\text{?}\)
Explanation.
The current, legal denominations of US paper money are \(\$1\text{,}\)\(\$2\text{,}\)\(\$5\text{,}\)\(\$10\text{,}\)\(\$20\text{,}\)\(\$50\text{,}\) and \(\$100\text{.}\) So the domain of \(f\) is the set \(\{1,2,5,10,20,50,100\}\text{.}\)
While most collections of numbers that we will encounter can be described using a combination of interval notation and set notation, there is another commonly used notation that is very useful in algebra: set-builder notation, which was introduced in Section 1.3. Set-builder notation also uses curly braces. Set-builder notation provides a template for what a number that is under consideration might look like, and then it gives you restrictions on how to use that template. A very basic example of set-builder notation is
Verbally, this is “the set of all \(x\) such that \(x\) is greater than or equal to \(3\text{.}\)” Table 14 gives more examples of set-builder notation in use.
Picture of Set
Set-Builder Notation
\(\{x\mid -2\lt x \leq3\}\)
\(\{x\mid x\lt1\text{ or }x>3\}\)
Figure11.2.14.Set-Builder Notation
Checkpoint11.2.15.
What is the domain of the function \(\operatorname{sqrt}\text{,}\) where \(\operatorname{sqrt}(x)=\sqrt{x}\text{,}\) using set-builder notation?
Explanation.
The function \(\operatorname{sqrt}\) cannot take a negative number as an input. It can however take any positive number as input, or the number \(0\) as input. Representing this on a number line, we find the domain is \(\{x\mid x\geq0\}\) in set-builder notation.
Example11.2.16.
What is the domain of the function \(A\text{,}\) where \(A(x)=\frac{2x+1}{x^2-2x-8}\text{?}\)
Note that if you plugged in some value for \(x\text{,}\) the only thing that might go wrong is if the denominator equals \(0\text{.}\) So a bad value for \(x\) would be when
Here, we used a basic factoring technique from Section 10.3. To continue, either
\begin{align*}
x + 2\amp=0\amp\text{or}\amp\amp x-4\amp=0\\
x\amp=-2\amp\text{or}\amp\amp x\amp=4\text{.}
\end{align*}
These are the bad\(x\)-values because they lead to division by \(0\) in the formula for \(A\text{.}\) So on a number line, if we wanted to picture the domain of \(A\text{,}\) we would make a sketch like:
So the domain is the union of three intervals: \((-\infty,-2)\cup(-2,4)\cup(4,\infty)\text{.}\)
Example11.2.17.
What is the domain of the function \(B\text{,}\) where \(B(x)=\sqrt{7-x}+3\text{?}\)
Note that if you plugged in some value for \(x\text{,}\) the only thing that might go wrong is if the value in the radical is negative. So the good values for \(x\) would be when
So on a number line, if we wanted to picture the domain of \(B\text{,}\) we would make a sketch like:
So the domain is the interval \((-\infty,7]\text{.}\)
There are three main properties of functions that cause numbers to be excluded from a domain, which are summarized here.
List11.2.18.Summary of Domain Restrictions
Denominators
Division by zero is undefined. So if a function contains an expression in a denominator, it will only be defined where that expression is not equal to zero.
The square root of a negative number is undefined. So if a function contains a square root, it will only be defined when the expression inside that radical is greater than or equal to zero. (This is actually true for any even \(n\)th radical.)
The domain of a function is the collection of its valid inputs; there is a similar notion for output.
Definition11.2.19.Range.
The range of a function \(f\) is the collection of all of its possible output values.
Example11.2.20.
Let \(f\) be the function defined by the formula \(f(x)=x^2\text{.}\) Finding \(f\)’s domain is straightforward. Any number anywhere can be squared to produce an output, so \(f\) has domain \((-\infty,\infty)\text{.}\) What is the range of \(f\text{?}\)
Explanation.
We would like to describe the collection of possible numbers that \(f\) can give as output. We will use a graphical approach. Figure 21 displays a graph of \(f\text{,}\) and the visualization that reveals \(f\)’s range.
Figure11.2.21.\(y=f(x)\) where \(f(x)=x^2\text{.}\) The second graph illustrates how to visualize the range. In the third graph, the range is marked as an interval on the \(y\)-axis.
Output values are the \(y\)-coordinates in a graph. If we “slide the ink” left and right over to the \(y\)-axis to emphasize what the \(y\)-values in the graph are, we have \(y\)-values that start from \(0\) and continue upward forever. Therefore the range is \([0,\infty)\text{.}\)
Example11.2.22.
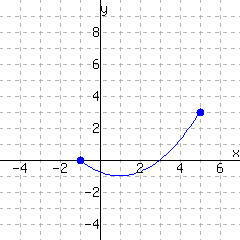
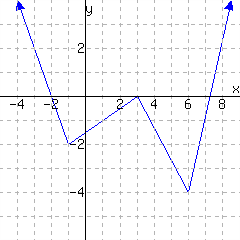
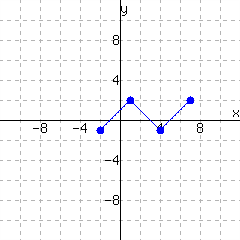
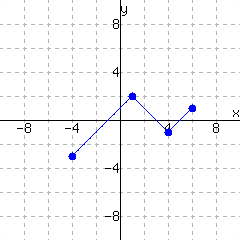
Given the function \(g\) graphed in Figure 23, find the domain and range of \(g\text{.}\)
Figure11.2.23.\(y=g(x)\)
Explanation.
To find the domain, we can visualize all of the \(x\)-values that are valid inputs for this function by “sliding the ink” down onto the \(x\)-axis. The arrows at the far left and far right of the curve indicate that whatever pattern we see in the graph continues off to the left and right. Here, we see that the arms of the graph appear to be tapering down to the \(x\)-axis and extending left and right forever. Every \(x\)-value can be used to get an output for the function, so the domain is \((-\infty,\infty)\text{.}\)
If we visualize the possible outputs by “sliding the ink” sideways onto the \(y\)-axis, we find that outputs as high as \(3\) are possible (including \(3\) itself). The outputs appear to get very close to \(0\) when \(x\) is large, but they aren’t quite equal to \(0\text{.}\) So the range is \((0,3]\text{.}\)
Figure11.2.24.Domain of \(g\)
Figure11.2.25.Range of \(g\)
Checkpoint11.2.26.
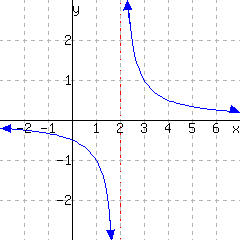
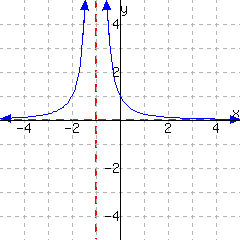
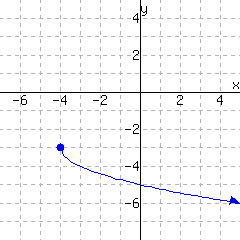
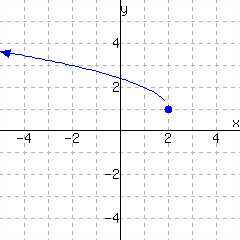
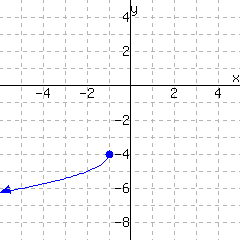
Given the function \(h\) graphed below, find the domain and range of \(h\text{.}\) Note there is an invisible vertical line at \(x=2\text{,}\) and the two arms of the graph are extending downward (and upward) forever, getting arbitrarily close to that vertical line, but never touching it. Also note that the two arms extend forever to the left and right, getting arbitrarily close to the \(x\)-axis, but never touching it.
The domain of \(h\) is and the range of \(h\) is .
Explanation.
To find the domain, we try to visualize all of the \(x\)-values that are valid inputs for this function. The arrows pointing left and right on the curve indicate that whatever pattern we see in the graph continues off to the left and right. So for \(x\)-values far to the right or left, we will be able to get an output for \(h\text{.}\)
The arrows pointing up and down are supposed to indicate that the curve will get closer and closer to the vertical line \(x=2\) after the curve leaves the viewing window we are using. So even when \(x\) is some number very close to \(2\text{,}\) we will be able to get an output for \(h\text{.}\)
The one \(x\)-value that doesn’t behave is \(x=2\text{.}\) If we tried to use that as an input, there is no point on the graph directly above or below that on the \(x\)-axis. So the domain is \((-\infty,2)\cup(2,\infty)\text{.}\)
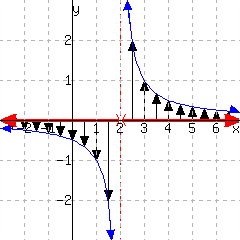
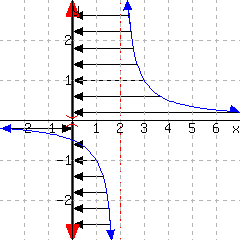
To find the range, we try to visualize all of the \(y\)-values that are possible outputs for this function. Sliding the ink of the curve left/right onto the \(y\)-axis reveals that \(y=0\) is the only \(y\)-value that we could never obtain as an output. So the range is \((-\infty,0)\cup(0,\infty)\text{.}\)
The examples of finding domain and range so far have all involved either a verbal description of a function, a formula for that function, or a graph of that function. Recall that there is a fourth perspective on functions: a table. In the case of a table, we have very limited information about the function’s inputs and outputs. If the table is all that we have, then there are a handful of input values listed in the table for which we know outputs. For any other input, the output is undefined.
Example11.2.27.
Consider the function \(k\) given in Figure 28. What is the domain and range of \(k\text{?}\)
\(x\)
\(k(x)\)
\(3\)
\(4\)
\(8\)
\(5\)
\(10\)
\(5\)
Figure11.2.28.
Explanation.
All that we know about \(k\) is that \(k(3)=4\text{,}\)\(k(8)=5\text{,}\) and \(k(10)=5\text{.}\) Without any other information such as a formula for \(k\) or a context for \(k\) that tells us its verbal description, we must assume that its domain is \(\{3,8,10\}\text{;}\) these are the only valid input for \(k\text{.}\) Similarly, \(k\)’s range is \(\{4,5\}\text{.}\)
Note that we have used set notation, not interval notation, since the answers here were lists of \(x\)-values (for the domain) and \(y\)-values (for the range). Also note that we could graph the information that we have about \(k\) in Figure 29, and the visualization of “sliding ink” to determine domain and range still works.
Figure11.2.29.
Warning11.2.30.Finding Range from a Formula.
Sometimes it is possible to find the range of a function using its formula without seeing its graph or a table. However, this often requires advanced techniques learned in calculus. Therefore when you are asked to find the range of a function based on its formula alone, your approach should be to examine a graph.
The following examples examine domain and range in context.
Example11.2.31.
You purchased a house in \(2010\) that was valued at \(\$250{,}000\text{.}\) In \(2015\text{,}\) the value of the house grew to \(\$300{,}000\text{.}\) Finally, in \(2020\text{,}\) you decided to sell the house.
Assume that the value of the house grows at a constant rate. Use a function to model the value of this house, starting the year you purchased it and ending in the year you sold it. Then find this function’s domain and range in this context.
Explanation.
Since we know that the value of the house grows at a constant rate, the function to model its value must be a linear function. We let \(V(x)\) denote the value of the house (in dollars) at year \(x\text{.}\) To find the slope for this linear function, we apply the slope formula with the points \((2010,250000)\) and \((2015,300000)\) taken from the given information.
This result tells us that the value of the house grows \(\$10{,}000\) per year. We can write a formula for \(V(x)\) in point-slope form using the slope found above and the point \((2015,300000)\text{.}\)
Since you owned the house from \(2010\) to \(2020\text{,}\) the domain (written in interval notation) of the function \(V\) is \([2010,2020]\text{.}\) Therefore, the range for this function must be the output values from \(V(2010)\) to \(V(2020)\text{.}\) We already know however that \(V(2010)=250000\) from the information given above. Thus we only need to calculate \(V(2020)\) below.
Thus, the range (written in interval notation) of the function is \([250000,350000]\text{.}\)
We can confirm these results by graphing the function within the domain \([2010,2020]\text{.}\)
Example11.2.32.
A ball is thrown from the top of a \(35\) foot tall building at an intitial vertical speed of \(65\) feet per second. In its flight, the ball misses the building and continue downward until it hits ground. The height \(H(t)\text{,}\) in feet, at \(t\) seconds after it was thrown is given by \(H(t)=-16t^2+65t+35\text{.}\)
Find the domain and range of this function in the context of this situation.
Explanation.
We observe that \(t=0\) seconds is the first valid input value. To find the final input value we need to find the time \(t\) when the ball hits the ground. That is, we need to solve \(H(t)=0\) for \(t\text{.}\) This equation gives \(-16t^2+65t+35=0\text{,}\) which we solve using the quadratic formula.
We ignore the negative solution since that is a time from before the ball was thrown. So the final valid input value must be \(t\approx4.544\) seconds. Therefore the domain (in interval notation) of the function is approximately \([0,4.544]\text{.}\) (The “4.544” is really \(\frac{-65-\sqrt{6465}}{-32}\text{.}\))
The range of this function must be from the minimum height of the ball’s flight to its maximum height. We already know that minimum height is \(0\) feet since the ball eventually hits the ground. We know that the graph of \(H\) forms a downward opening parabola, since \(H\) is a quadratic function with leading coefficient \(-16\text{,}\) which is negative. So the vertex of the parabola will tell us the maximum height. We find the vertex \((h,k)\) using the vertex formula.
Find the domain of \(g\) where \(g\mathopen{}\left(x\right)=3x-8\text{.}\)
38.
Find the domain of \(h\) where \(h\mathopen{}\left(x\right)=-5x+1\text{.}\)
39.
Find the domain of \(h\) where \(\displaystyle{h(x)={{\frac{10}{7}}x^{5}}}\text{.}\)
40.
Find the domain of \(F\) where \(\displaystyle{F(x)={{\frac{6}{5}}x^{2}}}\text{.}\)
41.
Find the domain of \(G\) where \(\displaystyle{G(x)=\lvert {-6x+6} \rvert}\text{.}\)
42.
Find the domain of \(H\) where \(\displaystyle{H(x)=\lvert {8x-6} \rvert}\text{.}\)
43.
Find the domain of \(\displaystyle{H}\) where \(\displaystyle{H(x)={\frac{6x}{x-1}}}\text{.}\)
44.
Find the domain of \(\displaystyle{K}\) where \(\displaystyle{K(x)={\frac{x}{x+7}}}\text{.}\)
45.
Find the domain of \(\displaystyle{f}\) where \(\displaystyle{f(x)={\frac{4x}{9x-7}}}\text{.}\)
46.
Find the domain of \(\displaystyle{g}\) where \(\displaystyle{g(x)={\frac{5x}{3x-8}}}\text{.}\)
47.
Find the domain of \(\displaystyle{h}\) where \(\displaystyle{h(x)={-\frac{8x+4}{x^{2}+4x-45}}}\text{.}\)
48.
Find the domain of \(\displaystyle{h}\) where \(\displaystyle{h(x)={\frac{6x+5}{x^{2}+19x+90}}}\text{.}\)
49.
Find the domain of \(\displaystyle{F}\) where \(\displaystyle{F(x)={-\frac{x+8}{x^{2}+4x}}}\text{.}\)
50.
Find the domain of \(\displaystyle{G}\) where \(\displaystyle{G(x)={\frac{1-8x}{x^{2}-x}}}\text{.}\)
51.
Find the domain of \(\displaystyle{H}\) where \(\displaystyle{H(x)={\frac{5x+10}{x^{2}-81}}}\text{.}\)
52.
Find the domain of \(\displaystyle{H}\) where \(\displaystyle{H(x)={-\frac{2x+2}{x^{2}-4}}}\text{.}\)
53.
Find the domain of \(\displaystyle{K}\) where \(\displaystyle{K(x)={\frac{6-9x}{49x^{2}-81}}}\text{.}\)
54.
Find the domain of \(\displaystyle{f}\) where \(\displaystyle{f(x)={\frac{4x-6}{16x^{2}-81}}}\text{.}\)
55.
Find the domain of \(\displaystyle{g}\) where \(\displaystyle{g(x)={\frac{3-3x}{x^{2}+1}}}\text{.}\)
56.
Find the domain of \(\displaystyle{h}\) where \(\displaystyle{h(x)={-\frac{10x+9}{x^{2}+8}}}\text{.}\)
57.
Find the domain of the function.
\(h(x)={\frac{3}{\sqrt{x-1}}}\)
58.
Find the domain of the function.
\(F(x)={-\frac{4}{\sqrt{x+8}}}\)
59.
Find the domain of the function.
\(G(x)={\sqrt{10-x}}\)
60.
Find the domain of the function.
\(H(x)={\sqrt{7-x}}\)
61.
Find the domain of the function.
\(H(x)={\sqrt{4+9x}}\)
62.
Find the domain of the function.
\(K(x)={\sqrt{10+17x}}\)
63.
Find the domain of \(q\) where \(\displaystyle{q(x)=\frac{x+2}{x^2-144}}\text{.}\)
64.
Find the domain of \(b\) where \(\displaystyle{b(x)=\frac{x+4}{x^2-25}}\text{.}\)
65.
Find the domain of \(n\) where \(\displaystyle{n(x)= \frac{16x+10}{x^2+ 3 x-18} }\text{.}\)
66.
Find the domain of \(t\) where \(\displaystyle{t(x)= \frac{16x+1}{x^2+ 4 x-32} }\text{.}\)
67.
Find the domain of \(B\) where \(\displaystyle{B(x)= \frac{\sqrt{11 + x}}{2 - x}}\text{.}\)
68.
Find the domain of \(c\) where \(\displaystyle{c(x)= \frac{\sqrt{13 + x}}{9 - x}}\text{.}\)
Domain and Range Using Context.
69.
Julie bought a used car for \({\$8{,}400}\text{.}\) The car’s value decreases at a constant rate each year. After \(8\) years, the value decreased to \({\$6{,}000}\text{.}\)
Use a function to model the car’s value as the number of years increases. Find this function’s domain and range in this context.
The function’s domain in this context is .
The function’s range in this context is .
70.
Maygen bought a used car for \({\$9{,}600}\text{.}\) The car’s value decreases at a constant rate each year. After \(10\) years, the value decreased to \({\$6{,}600}\text{.}\)
Use a function to model the car’s value as the number of years increases. Find this function’s domain and range in this context.
The function’s domain in this context is .
The function’s range in this context is .
71.
Assume a car uses gas at a constant rate. After driving \(30\) miles since a full tank of gas was purchased, there was \(8.8\) gallons of gas left; after driving \(60\) miles since a full tank of gas was purchased, there was \(7.6\) gallons of gas left.
Use a function to model the amount of gas in the tank (in gallons). Let the independent variable be the number of miles driven since a full tank of gas was purchased. Find this function’s domain and range in this context.
The function’s domain in this context is .
The function’s range in this context is .
72.
Assume a car uses gas at a constant rate. After driving \(15\) miles since a full tank of gas was purchased, there was \(9.4\) gallons of gas left; after driving \(55\) miles since a full tank of gas was purchased, there was \(7.8\) gallons of gas left.
Use a function to model the amount of gas in the tank (in gallons). Let the independent variable be the number of miles driven since a full tank of gas was purchased. Find this function’s domain and range in this context.
The function’s domain in this context is .
The function’s range in this context is .
73.
Kristen inherited a collection of coins when she was \(11\) years old. Ever since, she has been adding into the collection the same number of coins each year. When she was \(16\) years old, there were \(335\) coins in the collection. When she was \(24\) years old, there were \(535\) coins in the collection. At the age of \(56\text{,}\) Kristen donated all her coins to a museum.
Use a function to model the number of coins in Kristen’s collection, starting in the year she inherited the collection, and ending in the year the collection was donated. Find this function’s domain and range in this context.
The function’s domain in this context is .
The function’s range in this context is .
74.
Sydney inherited a collection of coins when she was \(11\) years old. Ever since, she has been adding into the collection the same number of coins each year. When she was \(20\) years old, there were \(595\) coins in the collection. When she was \(28\) years old, there were \(875\) coins in the collection. At the age of \(51\text{,}\) Sydney donated all her coins to a museum.
Use a function to model the number of coins in Sydney’s collection, starting in the year she inherited the collection, and ending in the year the collection was donated. Find this function’s domain and range in this context.
The function’s domain in this context is .
The function’s range in this context is .
75.
Assume a tree grows at a constant rate. When the tree was planted, it was \(2.8\) feet tall. After \(10\) years, the tree grew to \(6.8\) feet tall.
Use a function to model the tree’s height as time passes. With the context that the tree can live \(180\) years after planting, find this function’s domain and range.
The function’s domain in this context is .
The function’s range in this context is .
76.
Assume a tree grows at a constant rate. When the tree was planted, it was \(3\) feet tall. After \(7\) years, the tree grew to \(4.4\) feet tall.
Use a function to model the tree’s height as time passes. With the context that the tree can live \(160\) years after planting, find this function’s domain and range.
The function’s domain in this context is .
The function’s range in this context is .
77.
An object was shot up into the air at an initial vertical speed of \(512\) feet per second. Its height as time passes can be modeled by the quadratic function \(f\text{,}\) where \(f(t)={-16t^{2}+512t}\text{.}\) Here \(t\) represents the number of seconds since the object’s release, and \(f(t)\) represents the object’s height in feet.
Find the function’s domain and range in this context.
The function’s domain in this context is .
The function’s range in this context is .
78.
An object was shot up into the air at an initial vertical speed of \(544\) feet per second. Its height as time passes can be modeled by the quadratic function \(f\text{,}\) where \(f(t)={-16t^{2}+544t}\text{.}\) Here \(t\) represents the number of seconds since the object’s release, and \(f(t)\) represents the object’s height in feet.
Find the function’s domain and range in this context.
The function’s domain in this context is .
The function’s range in this context is .
79.
From a clifftop over the ocean \({98.49\ {\rm m}}\) above sea level, an object was shot straight up into the air with an initial vertical speed of \({93.59\ {\textstyle\frac{\rm\mathstrut m}{\rm\mathstrut s}}}\text{.}\) On its way down it missed the cliff and fell into the ocean, where it floats on the surface. Its height (above sea level) as time passes can be modeled by the quadratic function \(f\text{,}\) where \(f(t)={-4.9t^{2}+93.59t+98.49}\text{.}\) Here \(t\) represents the number of seconds since the object’s release, and \(f(t)\) represents the object’s height (above sea level) in meters.
Find the function’s domain and range in this context.
The function’s domain in this context is .
The function’s range in this context is .
80.
From a clifftop over the ocean \({130.83\ {\rm m}}\) above sea level, an object was shot straight up into the air with an initial vertical speed of \({125.93\ {\textstyle\frac{\rm\mathstrut m}{\rm\mathstrut s}}}\text{.}\) On its way down it missed the cliff and fell into the ocean, where it floats on the surface. Its height (above sea level) as time passes can be modeled by the quadratic function \(f\text{,}\) where \(f(t)={-4.9t^{2}+125.93t+130.83}\text{.}\) Here \(t\) represents the number of seconds since the object’s release, and \(f(t)\) represents the object’s height (above sea level) in meters.
Find the function’s domain and range in this context.
The function’s domain in this context is .
The function’s range in this context is .
81.
You will build a rectangular sheep pen next to a river. There is no need to build a fence along the river, so you only need to build three sides. You have a total of \(400\) feet of fence to use. Use a function to model the area, where the input is the length of the two sides perpendicular to the river. Find the function’s domain and range in this context.
The function’s domain is .
The function’s range is .
82.
You will build a rectangular sheep pen next to a river. There is no need to build a fence along the river, so you only need to build three sides. You have a total of \(410\) feet of fence to use. Use a function to model the area, where the input is the length of the two sides perpendicular to the river. Find the function’s domain and range in this context.
The function’s domain is .
The function’s range is .
83.
A student’s first name is a function of their student identification number.
Describe the domain for this function in a sentence. Specifics are not needed.
Describe the range for this function in a sentence. Specifics are not needed.
84.
The year a car was made is a function of its VIN (Vehicle Identification Number).
Describe the domain for this function in a sentence. Specifics are not needed.
Describe the range for this function in a sentence. Specifics are not needed.
Challenge.
85.
For each part, sketch the graph of a function with the given domain and range.
The domain is \((0, \infty)\) and the range is \((-\infty, 0)\text{.}\)
The domain is \((1,2)\) and the range is \((3,4)\text{.}\)
The domain is \((0,\infty)\) and the range is \([2,3]\text{.}\)
The domain is \((1,2)\) and the range is \((-\infty, \infty)\text{.}\)
The domain is \((-\infty, \infty)\) and the range is \((-1,1)\text{.}\)
The domain is \((0,\infty)\) and the range is \([0,\infty)\text{.}\)