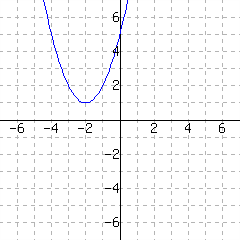
Hannah fired a toy rocket from the ground, which launched into the air with an initial speed of \(64\) feet per second. The height of the rocket can be modeled by the equation \(y=-16t^2+64t\text{,}\) where \(t\) is how many seconds had passed since the launch. To see the shape of the graph made by this equation, we make a table of values and plot the points.
A curve with the shape that we see in Figure 3 is called a parabola. Notice the symmetry in Figure 2, how the \(y\)-values in rows above the middle row match those below the middle row. Also notice the symmetry in the shape of the graph, how its left side is a mirror image of its right side.
The first feature that we will talk about is the direction that a parabola opens. All parabolas open either upward or downward. This parabola in the rocket example opens downward because \(a\) is negative. That means that for large values of \(t\text{,}\) the \(at^2\) term will be large and negative, and the resulting \(y\)-value will be low on the \(y\)-axis. So the negative leading coefficient causes the arms of the parabola to point downward.
The graph of a quadratic equation \(y=ax^2+bx+c\) opens upward or downward according to the sign of the leading coefficient \(a\text{.}\) If the leading coefficient is positive, the parabola opens upward. If the leading coefficient is negative, the parabola opens downward.
The graph of \(y=2+3x-x^2\) opens downward as the leading coefficient is \(-1\text{.}\) (Note that the leading coefficient is the coefficient on \(x^2\text{.}\))
The vertex of a quadratic graph is the highest or lowest point on the graph, depending on whether the graph opens downward or upward. In Figure 3, the vertex is \((2,64)\text{.}\) This tells us that Hannah’s rocket reached its maximum height of \(64\) feet after \(2\) seconds. If the parabola opens downward, as in the rocket example, then the \(y\)-value of the vertex is the maximum \(y\)-value. If the parabola opens upward then the \(y\)-value of the vertex is the minimum \(y\)-value.
The axis of symmetry is a vertical line that passes through the vertex, cutting the quadratic graph into two symmetric halves. We write the axis of symmetry as an equation of a vertical line so it always starts with “\(x=\text{.}\)” In Figure 3, the equation for the axis of symmetry is \(x=2\text{.}\)
The vertical intercept is the point where the parabola crosses the vertical axis. The vertical intercept is the \(y\)-intercept if the vertical axis is labeled \(y\text{.}\) In Figure 3, the point \((\firsthighlight{0},\secondhighlight{0})\) is the starting point of the rocket, and it is where the graph crosses the \(y\)-axis, so it is the vertical intercept. The \(y\)-value of \(\secondhighlight{0}\) means the rocket was on the ground when the \(t\)-value was \(\firsthighlight{0}\text{,}\) which was when the rocket launched.
The horizontal intercept(s) are the points where the parabola crosses the horizontal axis. They are the \(x\)-intercepts if the horizontal axis is labeled \(x\text{.}\) The point \((0,0)\) on the path of the rocket is also a horizontal intercept. The \(t\)-value of \(0\) indicates the time when the rocket was launched from the ground. There is another horizontal intercept at the point \((4,0)\text{,}\) which means the rocket came back to hit the ground after \(4\) seconds.
The horizontal intercept(s) are the point(s) where a graph intersects the horizontal axis. The graph of a parabola can have zero, one, or two horizontal intercepts.
Subsection1.2.2Finding the Vertex and Axis of Symmetry Algebraically
The coordinates of the vertex are not easy to identify on a graph if they are not integers. Another way to find the coordinates of the vertex is by using a formula.
If we denote \((h,k)\) as the coordinates of the vertex of a quadratic graph defined by \(y=ax^2+bx+c\text{,}\) then \(h=-\frac{b}{2a}\text{.}\) Then we can find \(k\) by substituting \(h\) in for \(x\text{.}\)
To understand why, we can look at [cross-reference to target(s) "fact-the-quadratic-formula" missing or not unique]. The vertex is on the axis of symmetry, so it will always occur halfway between the two \(x\)-intercepts (if there are any). The quadratic formula shows that the \(x\)-intercepts happen at \(-\frac{b}{2a}\) minus some number and at \(-\frac{b}{2a}\) plus that same number. So \(-\frac{b}{2a}\) is right in the middle, and it must be the horizontal coordinate of the vertex, \(h\text{.}\) If we have already memorized the quadratic formula, this new formula for \(h\) is not hard to remember:
Subsection1.2.3Graphing Quadratic Equations by Making a Table
When we learned how to graph lines, we could choose any \(x\)-values to build a table of values. For quadratic equations, we want to make sure the vertex is present in the table, since it is such a special point. So we find the vertex first and then choose our \(x\)-values surrounding it. We can use the property of symmetry to speed things up.
To determine the vertex of \(y=-x^2-2x+3\text{,}\) we want to find the \(x\)-value of the vertex first. We use \(h=-\frac{b}{2a}\) with \(a=-1\) and \(b=-2\text{:}\)
Now we know that our axis of symmetry is the line \(x=-1\) and the vertex is the point \((-1,4)\text{.}\) We set up our table with two values on each side of \(x=-1\text{.}\) We choose \(x=-3\text{,}\)\(-2\text{,}\)\(-1\text{,}\)\(0\text{,}\) and \(1\) as shown in Figure 20.
Next, we determine the \(y\)-coordinates by replacing \(x\) with each value and we have the complete table as shown in Figure 21. Notice that each pair of \(y\)-values on either side of the vertex match. This helps us to check that our vertex and \(y\)-values are correct.
Now that we have our table, we plot the points and draw in the axis of symmetry as shown in Figure 22. We complete the graph by drawing a smooth curve through the points and drawing an arrow on each end as shown in Figure 23.
The method we used works best when the \(x\)-value of the vertex is an integer. We can still make a graph if that is not the case as we will demonstrate in the next example.
Thus the vertex occurs at \(\left(\frac{3}{4},-\frac{41}{8}\right)\text{,}\) or at \((0.75,-5.125)\text{.}\) The axis of symmetry is then the line \(x=\frac{3}{4}\text{,}\) or \(x=0.75\text{.}\) Now that we know the \(x\)-value of the vertex, we create a table. We choose \(x\)-values on both sides of \(x=0.75\text{,}\) but we choose integers because it will be easier to find the \(y\)-values.
The points graphed in Figure 26 don’t have the symmetry we’d expect from a parabola. This is because the vertex occurs at an \(x\)-value that is not an integer, and all of the chosen values in the table are integers. We can use the axis of symmetry to determine more points on the graph (as shown in Figure 27), which will give it the symmetry we expect. From there, we can complete the sketch of this graph.
Subsection1.2.4Applications of Quadratic Graphs Involving the Vertex.
We looked at the height of Hannah’s toy rocket with respect to time at the beginning of this section and saw that it reached a maximum height of \(64\) feet after \(2\) seconds. Let’s look at some more applications that involve finding the minimum or maximum \(y\)-value on a quadratic graph.
Jae got a new air rifle for target practice. The first thing they did with it was some testing to find out how accurate the targeting cross-hairs were. In Olympic \(10\)-meter air rifle shooting, the bulls-eye is a 0.5 mm diameter dot, about the size of the head of a pin, so accuracy is key. To test the accuracy, Jae stood at certain specific distances from a bullseye target, aimed the cross-hairs on the bullseye, and fired. Jae recorded how far above or how far below the pellet hit relative to the bullseye.
Make a graph of the height of the pellet relative to the bulls-eye at the shooting distances Jae used in Figure 30 and find the vertex. What does the vertex mean in this context?
Note that values measured below the bulls-eye should be graphed as negative \(y\)-values. Keep in mind that the units on the axes are different: along the \(x\)-axis, the units are yards, whereas on the \(y\)-axis, the units are inches.
From the graph we can see that the point \((20,1.1)\) is our best guess for the vertex. This means the highest above the cross-hairs Jae hit was \(1.1\) inches when the target was \(20\) yards away.
We looked at the quadratic equation \(R=(13+0.25x)(1500-50x)\) in [cross-reference to target(s) "example-revenue" missing or not unique] of [cross-reference to target(s) "section-multiplying-polynomials" missing or not unique], where \(R\) was the revenue (in dollars) for \(x\) 25-cent price increases from an initial price of $13. The expression simplified to
Note that if we tried to use \(R=(13+0.25x)(1500-50x)\text{,}\) we would not be able to immediately identify the values of \(a\) and \(b\) needed to determine the vertex. Using the expanded form of \(R=-12.5x^2-275x+19500\text{,}\) we see that \(a=-12.5\) and \(b=-275\text{,}\) so the vertex occurs at:
We can calculate “\(-11\) of the 25-cent price increases” to be a decrease of $2.75. The price was set at $13 per jar, so the maximum revenue of $21,012.50 would occur when Avery sets the price at $10.25 per jar.
Kali has \(500\) feet of fencing and she needs to build a rectangular pen for her goats. What are the dimensions of the rectangle that would give her goats the largest area?
If a parabola’s vertex is at \((4,6)\text{,}\) and you know the coordinates of some points on the parabola where \(x=1,2,3\text{,}\) at what other \(x\)-values do you know coordinates on the parabola?
Finding Maximum and Minimum Values for Applications of Quadratic Equations.
45.
Consider two numbers where one number is \(4\) less than a second number. Find a pair of such numbers that has the least product possible. One approach is to let \(x\) represent the smaller number, and write an expression for the product of the two numbers. Then find its vertex and interpret it.
Consider two numbers where one number is \(5\) less than a second number. Find a pair of such numbers that has the least product possible. One approach is to let \(x\) represent the smaller number, and write an expression for the product of the two numbers. Then find its vertex and interpret it.
Consider two numbers where one number is \(6\) less than twice a second number. Find a pair of such numbers that has the least product possible. One approach is to let \(x\) represent the smaller number, and write a formula for a function of \(x\) that outputs the product of the two numbers. Then find its vertex and interpret it.
Consider two numbers where one number is \(10\) less than 4 times a second number. Find a pair of such numbers that has the least product possible. One approach is to let \(x\) represent the smaller number, and write a formula for a function of \(x\) that outputs the product of the two numbers. Then find its vertex and interpret it.
You will build a rectangular sheep enclosure next to a river. There is no need to build a fence along the river, so you only need to build on three sides. You have a total of \(450\) feet of fence to use. Find the dimensions of the pen such that you can enclose the maximum possible area. One approach is to let \(x\) represent the length of fencing that runs perpendicular to the river, and write an expression for the area of the enclosure. Then find its vertex and interpret it.
You will build a rectangular sheep enclosure next to a river. There is no need to build a fence along the river, so you only need to build on three sides. You have a total of \(470\) feet of fence to use. Find the dimensions of the pen such that you can enclose the maximum possible area. One approach is to let \(x\) represent the length of fencing that runs perpendicular to the river, and write an expression for the area of the enclosure. Then find its vertex and interpret it.
You will build a rectangular sheep enclosure next to a river. There is no need to build a fence along the river, so you only need to build on three sides. You have a total of \(480\) feet of fence to use. Find the dimensions of the pen such that you can enclose the maximum possible area. One approach is to let \(x\) represent the length of fencing that runs perpendicular to the river, and write an expression for the area of the enclosure. Then find its vertex and interpret it.
You will build a rectangular sheep enclosure next to a river. There is no need to build a fence along the river, so you only need to build on three sides. You have a total of \(490\) feet of fence to use. Find the dimensions of the pen such that you can enclose the maximum possible area. One approach is to let \(x\) represent the length of fencing that runs perpendicular to the river, and write an expression for the area of the enclosure. Then find its vertex and interpret it.
You will build two identical rectangular enclosures next to a each other, sharing a side. You have a total of \(420\) feet of fence to use. Find the dimensions of each pen such that you can enclose the maximum possible area. One approach is to let \(x\) represent the length of fencing that the two pens share, and write a formula for the total area of the enclosures. Then find its vertex and interpret it.
You will build two identical rectangular enclosures next to a each other, sharing a side. You have a total of \(300\) feet of fence to use. Find the dimensions of each pen such that you can enclose the maximum possible area. One approach is to let \(x\) represent the length of fencing that the two pens share, and write a formula for the total area of the enclosures. Then find its vertex and interpret it.
You plan to build four identical rectangular animal enclosures in a row. Each adjacent pair of pens share a fence between them. You have a total of \(328\) feet of fence to use. Find the dimensions of each pen such that you can enclose the maximum possible area. One approach is to let \(x\) represent the length of fencing that adjacent pens share, and write a formula for a function of \(x\) that outputs the total area. Then find its vertex and interpret it.
The length of each pen (along the walls that they share) should be , the width (perpendicular to the river) should be , and the maximum possible area of each pen is .
You plan to build four identical rectangular animal enclosures in a row. Each adjacent pair of pens share a fence between them. You have a total of \(336\) feet of fence to use. Find the dimensions of each pen such that you can enclose the maximum possible area. One approach is to let \(x\) represent the length of fencing that adjacent pens share, and write a formula for a function of \(x\) that outputs the total area. Then find its vertex and interpret it.
The length of each pen (along the walls that they share) should be , the width (perpendicular to the river) should be , and the maximum possible area of each pen is .
Currently, an artist can sell \(240\) paintings every year at the price of \({\$90.00}\) per painting. Each time he raises the price per painting by \({\$15.00}\text{,}\) he sells \(5\) fewer paintings every year.
To earn \({\$43{,}875.00}\) per year, the artist could sell his paintings at two different prices. The lower price is per painting, and the higher price is per painting.
Currently, an artist can sell \(270\) paintings every year at the price of \({\$150.00}\) per painting. Each time he raises the price per painting by \({\$5.00}\text{,}\) he sells \(5\) fewer paintings every year.
To earn \({\$43{,}700.00}\) per year, the artist could sell his paintings at two different prices. The lower price is per painting, and the higher price is per painting.