
Section 1.4 Graphically Solving Equations and Inequalities
It is possible to solve equations and inequalities simply by reading a graph well. In this section, we take that approach to solving equations.
Subsection 1.4.1 Solving Equations Using a Graph
To algebraically solve an equation like \(-0.01x^2+0.7x-18=-0.04x^2-3.6x+32\text{,}\) we’d start by rearranging terms so that we could apply the quadratic formula. That would be a lot of pencil-and-paper work, and a lot of opportunity to make human errors. An alternative is to graphically solve this equation. We start by graphing both
\begin{align*}
y\amp=-0.01x^2+0.7x-18\amp\amp\text{and}\amp y\amp=-0.04x^2-3.6x+32\text{.}
\end{align*}
It happens that we learned how to graph equations like these by hand in Section 3, but we will “cheat” in this section and use graphing technology to just make the graphs for us.
Example 1.4.2.
Solve the equation \(-0.01x^2+0.7x-18=-0.04x^2-3.6x+32\) graphically.
Explanation.

There are two points of intersection where the curves cross each other: \((22.46,28.677)\) and \((74.207,14.878)\text{.}\) Each one of them tells you a solution to the equation we started with. The point \((22.46,28.677)\) means that when \(x\) is about \(22.46\text{,}\) both \(-0.01x^2+0.7x-18\) and \(-0.04x^2-3.6x+32\) work out to the same result. That result is about \(28.677\text{,}\) but that really doesn’t matter right now. Its the \(x\)-value, about \(22.46\text{,}\) that matters. That is one solution to the equation.
The second point of intersection similarly shows us that \(74.207\) is another approximate solution. We can conclude that the solution set to the equation is approximately \(\{22.46,74.207\}\text{.}\)
Example 1.4.4.
Graphically solve the equation \(-0.01(x-90)(x+20)=25\text{.}\)
Explanation.
Start by graphing two curves on the same plot: \(y=\text{left}\) and \(y=\text{right}\text{.}\) Specifically for this example, \(y=-0.01(x-90)(x+20)\) and \(y=25\text{.}\)

One excellent thing about solving equations graphically is that it doesn’t really matter what “kind” of equation it is. The equation can have mathematics in it that you haven’t specifically studied, but as long as something (like a computer or your teacher) provides you with the graphs, you can still solve the equation.
Example 1.4.6.
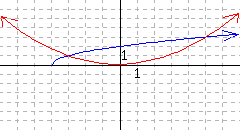
Graphically solve the equation \(\lvert x+5\rvert=\frac{1}{x+1}\text{.}\)
Explanation.
If you’ve only been learning algebra from this textbook, this equation has some unfamiliar bits and pieces. The vertical bars in \(\lvert x+5\rvert\) represent the basic math concept of absolute value, which you can brush up on in Appendix A.3. On the other side of the equation there is the expression \(\frac{1}{x+1}\text{,}\) with a variable in the denominator. This textbook hasn’t discussed such things yet.
Even though we don’t yet have general knowledge for these kinds of math expressions and their graphs, we can still trust some source to provide the graphs for us.

If we are solving graphically and something is already providing you with the graph, it’s not even necessary to have math expressions for the two curves.
Example 1.4.8.
In Figure 9, there are two curves plotted. The horizontal axis represents years, one curve represents the population of California, and the other curve represents the population of New York. In what year did the population of California equal the population of New York?
It appears there is only one point of intersection at about \((1963,17.5)\text{.}\) So the solution set is approximately \(\{1963\}\text{.}\) But in context, this says that 1963 is the year when California’s population equaled New York’s.

Subsection 1.4.2 Solving Inequalities Using a Graph
In
[cross-reference to target(s) "part-linear-equations-and-lines" missing or not unique] of this book, we learn how to solve linear inequalities such as \(2x+1\lt5\) using algebra. By using graphs instead of symbolic algebra, we can solve inequalities with more complicated math expressions, as well as inequalities in context that may not even have math expressions.
Example 1.4.10.
In Figure 11, there are two curves plotted. The horizontal axis represents years, one curve represents the percent of US women ages 25–34 years old participating in the workforce, and the other curve represents the percent of US women ages 45–54 years old participating in the workforce. When was the percent from the 25–34 group more than the percent from the 45–54 group?
The curve for women 25–34 appears to rise above the other curve between the years 1975 and 1997. So the solution set is the interval \((1975,1997)\text{.}\) But in context, this means that in between 1975 and 1997, the percentage of women 25–34 in the workforce was greater than the percentage of women 45–54 in the workforce.

It is helpful to take another look at this graph, with some annotations. We wanted the 25–34 curve to be greater than the 45–54 curve. Visually, we lock sights onto the indicated region. The solution set we are looking for is the years that this happened, which are down on the horizontal axis. So we have to project the region we’ve identified down onto the horizontal axis. After we’ve done this, the interval we see on the horizontal axis is the solution set.

Example 1.4.13.
Graphically solve the following inequalities.
-
\(\displaystyle -20t^2-70t+300 \geq -5t+300\)
-
\(\displaystyle -20t^2-70t+300 \lt -5t+300\)
Explanation.
For both parts of this example, we start by graphing the equations \(y=-20t^2-70t+300\) and \(y=-5t+300\) and determining the points of intersection. You may use some piece of technology to do this, or perhaps you find yourself provided with these graphs, with the intersection points clearly marked or easy to determine.

-
To solve \(-20t^2-70t+300 \geq -5t+300\text{,}\) we need to determine where the \(y\)-values of the parabola are higher than (or equal to) those of the line. This region is highlighted in Figure 15.We can see that this region includes all values of \(t\) between, and including, \(t=-3.25\) and \(t=0\text{.}\) So the solutions to this inequality include all values of \(t\) for which \(-3.25\le t \le 0\text{.}\) We can write this solution set in
[cross-reference to target(s) "definition-interval-notation" missing or not unique]as \([-3.25,0]\) or in[cross-reference to target(s) "definition-set-builder-notation" missing or not unique]as \(\{t \mid -3.25 \leq t \leq 0\}\text{.}\)
Figure 1.4.15. -
To now solve \(-20t^2-70t+300 \lt -5t+300\text{,}\) we will need to determine where the \(y\)-values of the parabola are less than those of the line. This region is highlighted in Figure 16.We can see that \(-20t^2-70t+300 \lt -5t+300\) for all values of \(t\) where \(t\lt -3.25\) or \(t\gt 0\text{.}\) We can write this solution set in
[cross-reference to target(s) "definition-interval-notation" missing or not unique]as \((-\infty,-3.25)\cup(0,\infty)\) or in[cross-reference to target(s) "definition-set-builder-notation" missing or not unique]as \(\{t\mid t\lt -3.25 \text{ or } t\gt 0\}\text{.}\)
Figure 1.4.16.
Occasionally, a curve abruptly “stops”, and we need to recognize this in a solution to an inequality.
Example 1.4.17.
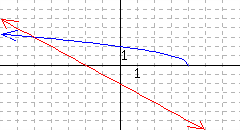
Solve the inequality \(1-x\gt\sqrt{x+5}\) using a graph.
Explanation.

Since the inequality is \(\overbrace{1-x}^{\text{line}}\gt\overbrace{\sqrt{x+5}}^{\text{half-parabola}}\text{,}\) we want to identify the region where the line is higher than the half-parabola. While the line extends higher and higher off to the left, the half-parabola abruptly stops at \((-5,0)\text{.}\) So the solution set needs to stop at the corresponding place. As illustrated, the solution set is the interval \([-5,-1)\text{.}\)

Reading Questions 1.4.3 Reading Questions
1.
Suppose you have an equation where \(x\) is the only variable. In order to solve that equation, explain how you could use a graph. Assume that some technology can provide you with any graph you would like to see.
2.
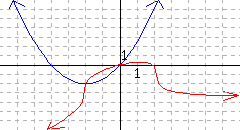
The curves \(y=x^4-3x^2+x\) and \(y=1-\sqrt{x-1}\) cross at three locations. How many solutions are there to \(x^4-3x^2+x=1-\sqrt{x-1}\text{?}\)
3.
The solution set to an inequality is generally not a single number or a small collection of numbers. In general, the solution set to an inequality is a .
Exercises 1.4.4 Exercises
Points of Intersection.
1.
2.
3.
4.
5.
6.
7.
8.
Solving Equations and Inequalities Graphically.
9.
10.
11.
12.
13.
14.
15.
16.
17.
18.
19.
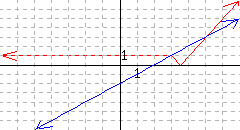
The equations \(y={\frac{1}{2}x^{2}+2x}\) and \(y={\sqrt[3]{9-2x^{2}}+\frac{23}{50}x-\frac{52}{25}}\) are plotted.
20.
You have attempted of activities on this page.
