4.2. What is a Graph?

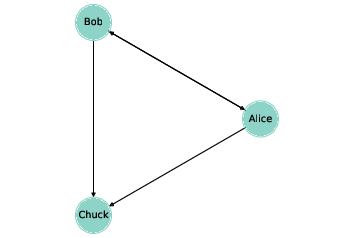
Figure 4.1: A directed graph that represents a social network.
To most people a “graph” is a visual representation of data, like a bar chart or a plot of stock prices over time. That’s not what this chapter is about.
In this chapter, a graph is a representation of a system that contains discrete, interconnected elements. The elements are represented by nodes — also called vertices – and the interconnections are represented by edges.
For example, you could represent a road map with a node for each city and an edge for each road between cities. Or you could represent a social network using a node for each person, with an edge between two people if they are friends.
In some graphs, edges have attributes like length, cost, or weight. For example, in a road map, the length of an edge might represent distance between cities or travel time. In a social network there might be different kinds of edges to represent different kinds of relationships: friends, business associates, etc.
Edges may be directed or undirected, depending on whether the relationships they represent are asymmetric or symmetric. In a road map, you might represent a one-way street with a directed edge and a two-way street with an undirected edge. In some social networks, like Facebook, friendship is symmetric: if A is friends with B then B is friends with A. But on Twitter, for example, the “follows” relationship is not symmetric; if A follows B, that doesn’t imply that B follows A. So you might use undirected edges to represent a Facebook network and directed edges for Twitter.
Graphs have interesting mathematical properties, and there is a branch of mathematics called graph theory that studies them.
Graphs are also useful, because there are many real world problems that can be solved using graph algorithms. For example, Dijkstra’s shortest path algorithm is an efficient way to find the shortest path from a node to all other nodes in a graph. A path is a sequence of nodes with an edge between each consecutive pair.
Graphs are usually drawn with squares or circles for nodes and lines for edges. For example, the directed graph in Figure 4.1 might represent three people who follow each other on Twitter. The arrow indicates the direction of the relationship. In this example, Alice and Bob follow each other, both follow Chuck, and Chuck follows no one.
The undirected graph in Figure 4.2 shows four cities in the northeast United States; the labels on the edges indicate driving time in hours. In this example the placement of the nodes corresponds roughly to the geography of the cities, but in general the layout of a graph is arbitrary.