
4.3. NetworkX
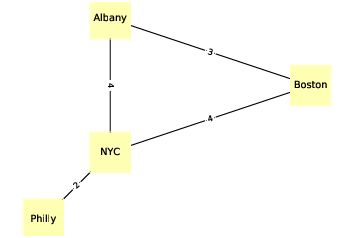
Figure 4.2: An undirected graph that represents driving time between cities.
To represent graphs, we’ll use a package called NetworkX, which is the most commonly used network library in Python.
We can create a directed graph by importing NetworkX (usually imported as nx) and instantiating nx.DiGraph:
import networkx as nx
G = nx.DiGraph()
At this point, G is a DiGraph object that contains no nodes and no edges. We can add nodes using the add_node method:
G.add_node('Alice')
G.add_node('Bob')
G.add_node('Chuck')
Now we can use the nodes method to get a list of nodes:
(G.nodes())
NodeView(('Alice', 'Bob', 'Chuck'))
The nodes method returns a NodeView, which can be used in a for loop or, as in this example, used to make a list.
Adding edges works pretty much the same way:
G.add_edge('Alice', 'Bob')
G.add_edge('Alice', 'Chuck')
G.add_edge('Bob', 'Alice')
G.add_edge('Bob', 'Chuck')
And we can use edges to get the list of edges:
(G.edges())
[('Alice', 'Bob'), ('Alice', 'Chuck'),
('Bob', 'Alice'), ('Bob', 'Chuck')]
NetworkX provides several functions for drawing graphs; draw_circular arranges the nodes in a circle and connects them with edges:
(nx.draw_circular(G,
             node_color=COLORS[0],
             node_size=2000,
             with_labels=True)
That’s the code I use to generate Figure 4.1. The option with_labels causes the nodes to be labeled; in the next example we’ll see how to label the edges.
To generate Figure 4.2, I start with a dictionary that maps from each city name to its approximate longitude and latitude:
positions = dict(Albany=(-74, 43),
            Boston=(-71, 42),
            NYC=(-74, 41),
            Philly=(-75, 40))
Since this is an undirected graph, I instantiate nx.Graph:
G = nx.Graph()
Then I can use add_nodes_from to iterate the keys of positions and add them as nodes:
G.add_nodes_from(positions)
Next we will make a dictionary that maps from each edge to the corresponding driving time:
drive_times = {('Albany', 'Boston'): 3,
          ('Albany', 'NYC'): 4,
          ('Boston', 'NYC'): 4,
          ('NYC', 'Philly'): 2}
Now I can use add_edges_from, which iterates the keys of drive_times and adds them as edges:
G.add_edges_from(drive_times)
Instead of draw_circular, which arranges the nodes in a circle, we will use draw, which takes the position dictionary as the second parameter:
nx.draw(G, positions,
   node_color=COLORS[1],
   node_shape='s',
   node_size=2500,
   with_labels=True)
draw uses positions to determine the locations of the nodes.
To add the edge labels, we use draw_networkx_edge_labels:
x.draw_networkx_edge_labels(G, positions,
                        edge_labels=drive_times)
The edge_labels parameter expects a dictionary that maps from each pair of nodes to a label; in this case, the labels are driving times between cities. And that’s how I generated Figure 4.2.
In both of these examples, the nodes are strings, but in general they can be any hashable type.
-
Q-1:
- Positions
- A dictionary that maps from each city name to its approximate longitude and latitude.
- Add_nodes_from
- This is a method that iterates through the keys of positions and adds them as nodes.
- Drive_times
- A dictionary that maps from each edge to the corresponding driving time.
- Add_edges_from
- This method iterates the keys of drive_times and adds them as edges.
- Draw
- Takes the position dictionary as the second parameter, and uses positions to determine the locations of the nodes.
- Draw_networkx_edge_labels
- This method adds edge labels.
- edge_labels
- This parameter expects a dictionary that maps from each pair of nodes to a label; in this case, the labels are driving times between cities.