
Section A.10 Chapter 10 Logarithmic Functions
Subsection A.10.1 Logarithmic Functions
Subsubsection A.10.1.1 Graph log functions
One way to graph a log function is to first make a table of values for its inverse function, the exponential function with the same base, then interchange the variables.


Subsubsection A.10.1.2 Use function notation
A log function is the inverse of the exponential function with the same base, and vice versa.
Example A.10.2.
Solution.
-
So for this function,
-
So for this function,
Checkpoint A.10.3.
Example A.10.4.
Checkpoint A.10.5.
Checkpoint A.10.6.
Subsubsection A.10.1.3 Use the properties of logarithms
The three properties of logarithms are helpful in making computations involving logs.
Properties of Logarithms.
Example A.10.7.
Example A.10.8.
Checkpoint A.10.9.
Checkpoint A.10.10.
Compare the two operations. What do you notice?
-
(i) Compute
-
(i) Compute
Checkpoint A.10.11.
Subsection A.10.2 Logarithmic Scales
Subsubsection A.10.2.1 Plot a log scale
Because
Example A.10.12.
-
Complete the table. Round the values to one decimal place.
-
Plot the values of
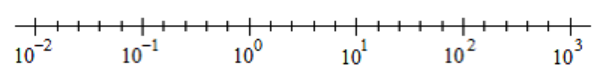
-
Each time we multiply
Solution.
-
-

-
Each time we multiply
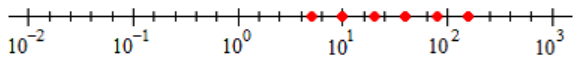
Checkpoint A.10.13.
-
Complete the table. Round the values to one decimal place.
-
Plot the values of
-
Each time we multiply
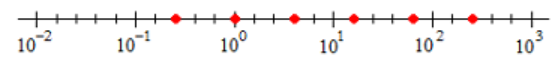
Checkpoint A.10.14.
-
Complete the table. Round the values to one decimal place.
-
Plot the values of
-
Each time we multiply
Subsubsection A.10.2.2 Compare quantities
There is often more than one way to express a comparison with mathematical notation.
Example A.10.15.
Example A.10.16.
Checkpoint A.10.17.
From the list above, match all the correct algebraic expressions to the phrase "
Checkpoint A.10.18.
Subsection A.10.3 The Natural Base
Subsubsection A.10.3.1 Graphs of
The graphs of the natural exponential function and the natural log function have some special properties.
Checkpoint A.10.19.

Checkpoint A.10.20.

Subsubsection A.10.3.2 Using growth and decay laws with base
We can write exponential growth and decay laws using base
Exponential Growth and Decay.
Example A.10.21.
A colony of bees grows at a rate of 8% annually. Write its growth law using base
Solution.
The growth factor is
Using base
The growth law is
Example A.10.22.
A radioactive isotope decays according to the formula
Solution.
Checkpoint A.10.23.
A virus spreads in the population at a rate of 19.5% daily. Write its growth law using base
Checkpoint A.10.24.
Sea ice is decreasing at a rate of 12.85% per decade. Write its decay law using base
Checkpoint A.10.25.
In 2020, the world population was growing according to the formula
Checkpoint A.10.26.
Since 1984, the population of cod has decreased annually according to the formula
You have attempted 1 of 1 activities on this page.
