Example B.5.2.
Make a scatterplot for the points
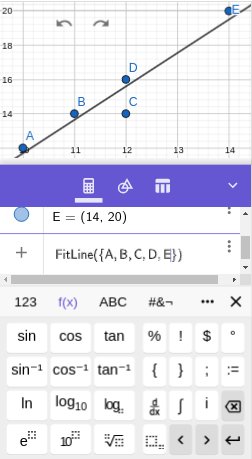
We enter each of the five ordered pairs. The output history will show each labeled with a capital letter, such as
We do a Zoom to fit: right-click on the Graphics View (or click on the gear icon) and select Zoom to fit.
We next enter the FitLine command:
using the ABC keyboard shown above for the letters, the 123 keyboard (keyboard image) for the parentheses, and the f(x) keyboard (keyboard image) for the list curly braces {}.
Important: We must enter capital letters for the names of the points--GeoGebra is case-sensitive regarding labels.