SAT scores follow a normal distribution, \(N(1100, 200)\text{.}\) Ann earned a score of 1300 on her SAT with a corresponding Z-score of \(Z = 1\text{.}\) She would like to know what percentile she falls in among all SAT test-takers.
Solution.
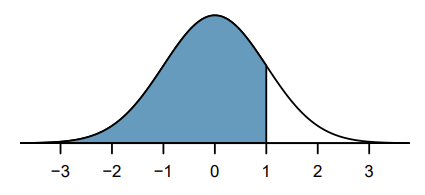
Ann’s percentile is the percentage of people who earned a lower SAT score than her. We shade the area representing those individuals in the following graph:

The total area under the normal curve is always equal to 1, and the proportion of people who scored below Ann on the SAT is equal to the area shaded in the graph. We find this area by looking in row 1.0 and column 0.00 in the normal probability table: 0.8413. In other words, Ann is in the 84th percentile of SAT takers.


