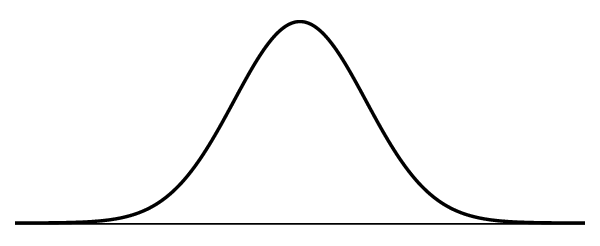
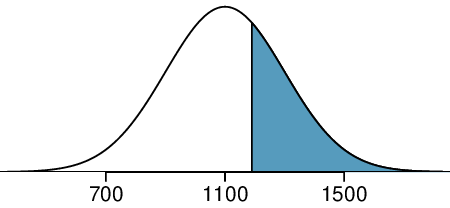
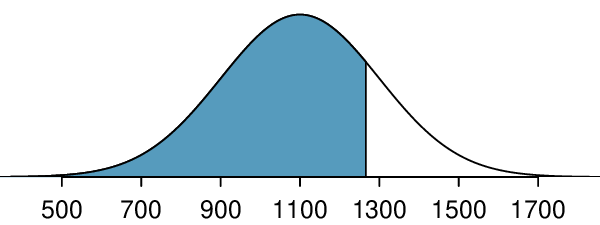
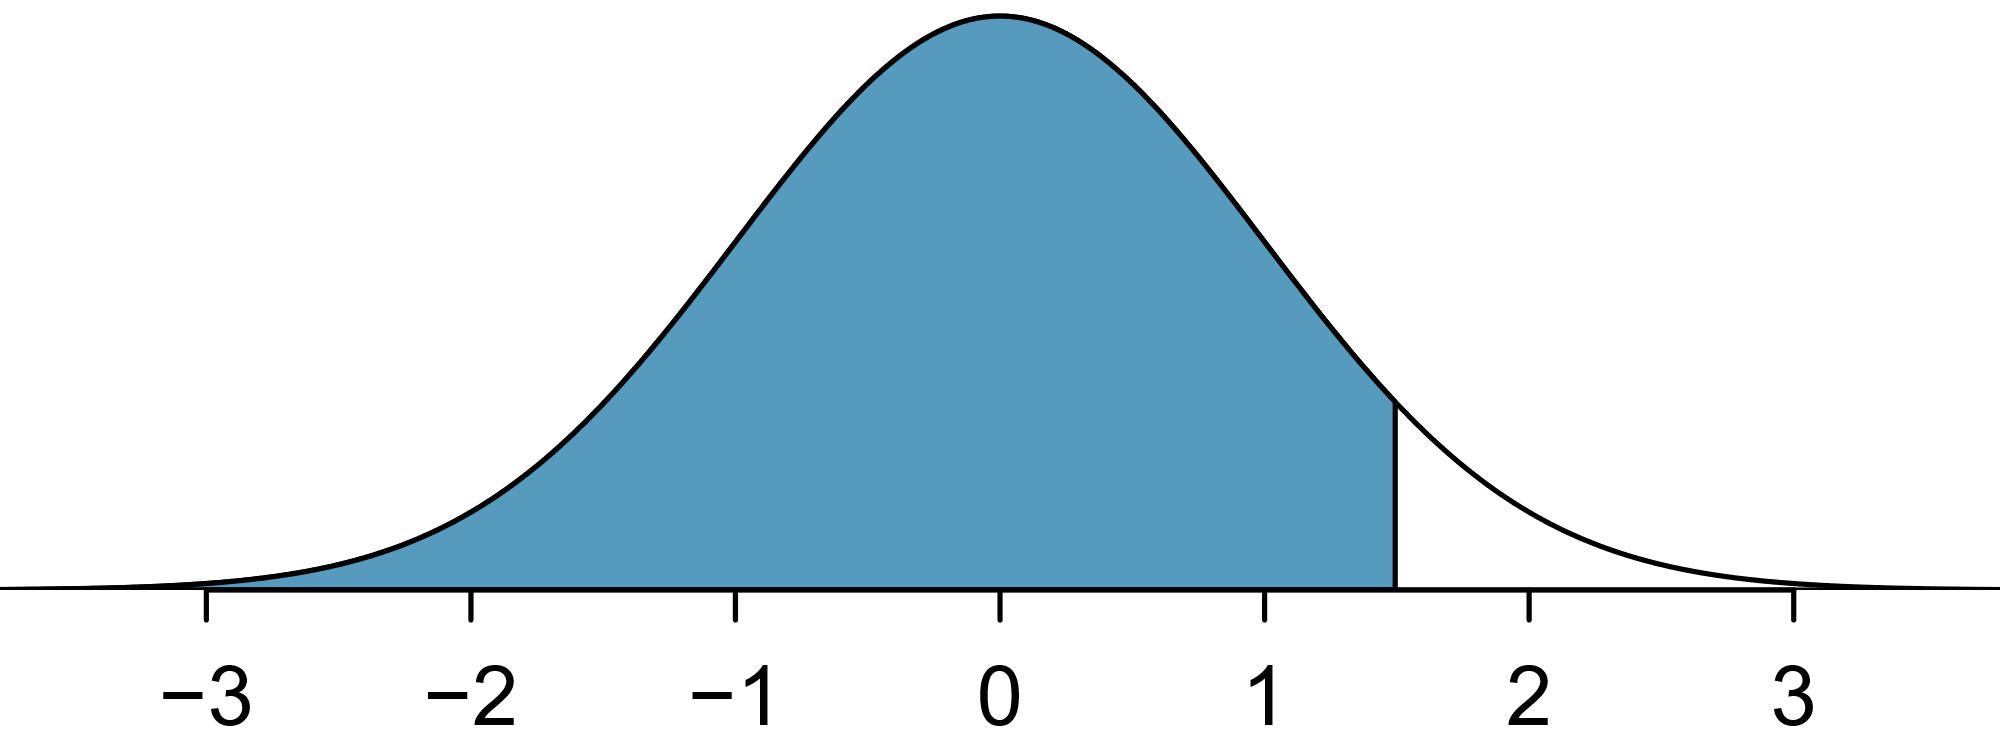
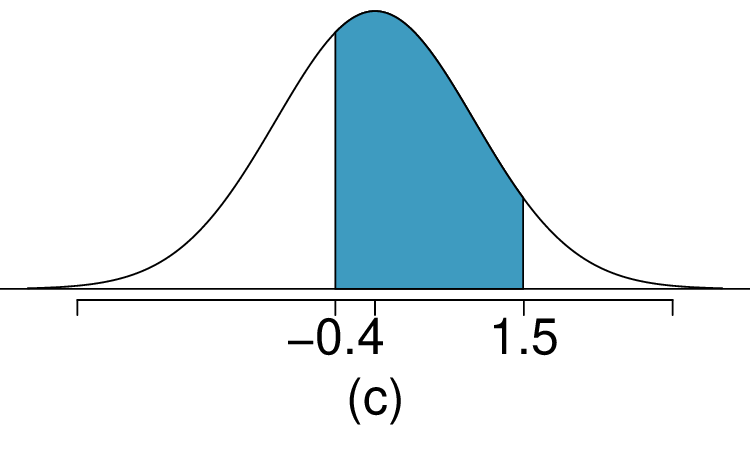
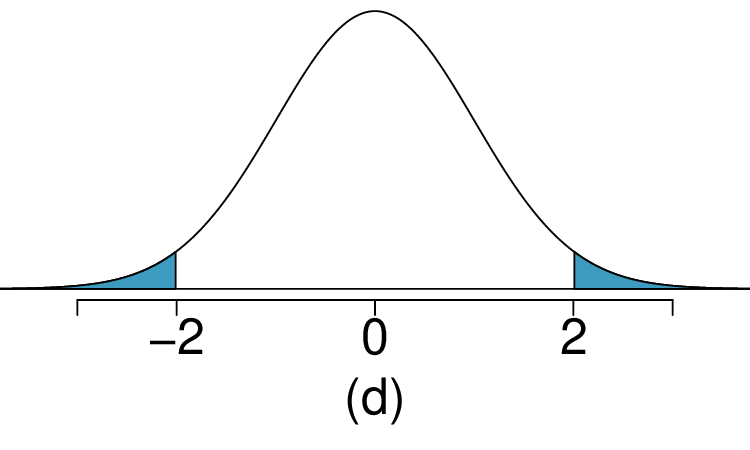
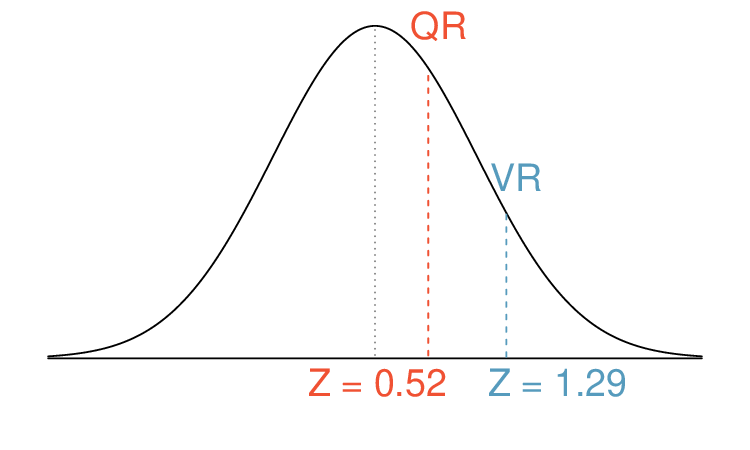
The probability that a randomly selected SAT taker scores at least 1190 on the SAT is equivalent to the proportion of all SAT takers that score at least 1190 on the SAT. First, always draw and label a picture of the normal distribution. (Drawings need not be exact to be useful.) We are interested in the probability that a randomly selected score will be above 1190, so we shade this upper tail:
The picture shows the mean and the values at 2 standard deviations above and below the mean. The simplest way to find the shaded area under the curve makes use of the Z-score of the cutoff value. With \(\mu=1100\text{,}\) \(\sigma=200\text{,}\) and the cutoff value \(x=1190\text{,}\) the Z-score is computed as
\begin{gather*}
Z = \frac{x - \mu}{\sigma} = \frac{1190 - 1100}{200} = \frac{90}{200} = 0.45
\end{gather*}
Next, we want to find the area under the normal curve to the right of
\(Z=0.45\text{.}\) Using technology, we find
\(P(Z>0.45)=0.3264\text{.}\) The probability that a randomly selected score is at least 1190 on the SAT is 0.3264.
