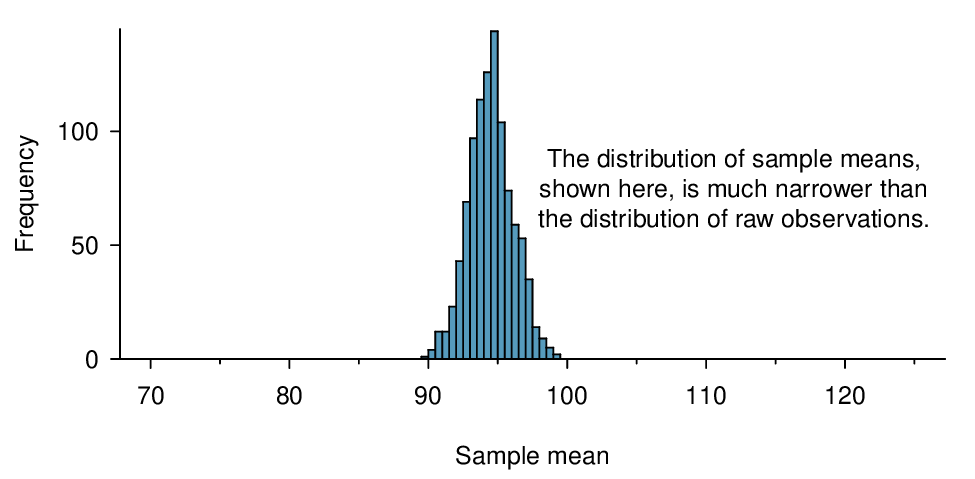
Here, \(n=20\lt 30\text{,}\) but the distribution of the population, that is, the distribution of run times is stated to be approximately normal. Because of this, the sampling distribution will be normal for any sample size.
\begin{align*}
\amp \sigma_{\bar{x}}=\frac{\sigma}{\sqrt{n}}=\frac{8.97}{\sqrt{20}}=2.01\\
\amp Z = \frac{\bar{x} - \mu_{\bar{x}}}{\sigma_{\bar{x}}}=\frac{90-94.52}{2.01}=-2.25\\
\amp P(Z \lt -2.25) = 0.0123
\end{align*}
There is a 1.23% probability that the average run time of 20 randomly selected runners will be less than 90 minutes.