9.4. Percolation
Percolation is a process in which a fluid flows through a semi-porous material. Examples include oil in rock formations, water in paper, and hydrogen gas in micropores. Percolation models are also used to study systems that are not literally percolation, including epidemics and networks of electrical resistors.
Percolation models are often represented using random graphs like the ones we saw in Section 4.2, but they can also be represented using cellular automatons. In the next few sections we’ll explore a 2-D CA that simulates percolation.
In this model:
Initially, each cell is either “porous” with probability
qor “non-porous” with probability1-q.When the simulation begins, all cells are considered “dry” except the top row, which is “wet”.
During each time step, if a porous cell has at least one wet neighbor, it becomes wet. Non-porous cells stay dry.
The simulation runs until it reaches a “fixed point” where no more cells change state.
If there is a path of wet cells from the top to the bottom row, we say that the CA has a “percolating cluster”.
Two questions of interest regarding percolation are (1) the probability that a random array contains a percolating cluster, and (2) how that probability depends on q. These questions might remind you of Section 4.4 where we considered the probability that a random Erdős-Rényi graph is connected. We will see several connections between that model and this one.
I define a new class to represent a percolation model:
class Percolation(Cell2D):

    def __init__(self, n, q):
        self.q = q
        self.array = np.random.choice([1, 0], (n, n), p=[q, 1-q])
        self.array[0] = 5
n and m are the number of rows and columns in the CA.
The state of the CA is stored in array, which is initialized using np.random.choice to choose 1 (porous) with probability q, and 0 (non-porous) with probability 1-q.
The state of the top row is set to 5, which represents a wet cell. Using 5, rather than the more obvious 2, makes it possible to use correlate2d to check whether any porous cell has a wet neighbor. Here is the kernel:
kernel = np.array([[0, 1, 0],
                   [1, 0, 1],
                   [0, 1, 0]])
This kernel defines a 4-cell “von Neumann” neighborhood; unlike the Moore neighborhood we saw in Section 8.2, it does not include the diagonals.
This kernel adds up the states of the neighbors. If any of them are wet, the result will exceed 5. Otherwise the maximum result is 4 (if all neighbors happen to be porous).
We can use this logic to write a simple, fast step function:
def step(self):
   a = self.array
   c = correlate2d(a, self.kernel, mode='same')
   self.array[(a==1) & (c>=5)] = 5
This function identifies porous cells, where a==1, that have at least one wet neighbor, where c>=5, and sets their state to 5, which indicates that they are wet.

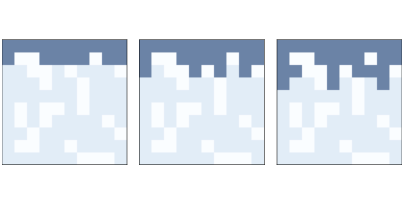
Figure 9.5: The first three steps of a percolation model with n=10 and p=0.7.
Figure 9.5 shows the first few steps of a percolation model with n=10 and p=0.7. Non-porous cells are white, porous cells are lightly shaded, and wet cells are dark.

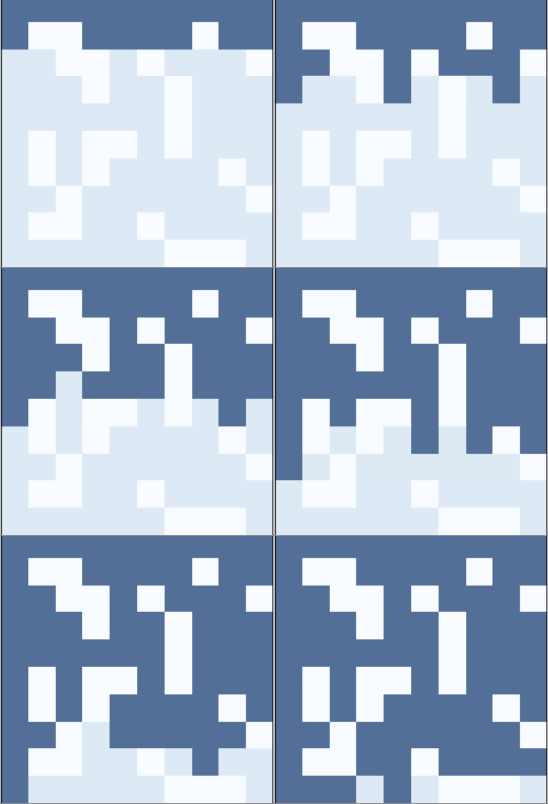
Gif of how liquid interacts with porous and non-porous cells.
- The way it moves can be in any direction
- There are limitations to their movement please look again.
- It can move up and down but not diagonal
- Correct.
- It can move diagonal.
- Sorry try again, this is not the limitation set on the movement
- It can only move into non-porous cells.
- Incorrect. Please refer back to section.
Q-2: How does the different type of “neighborhood” affect the movement path of the “wet” cells?
- True
- Incorrect.
- False
- Correct. Only the porous cell becomes wet, the non-porous cell stays dry.
Q-3: If a porous cell and a non-porous cell has at least one wet neighbor they both become wet.