
6.7. Case Study 2: Graphing Business Data on a Map
In this section, we will explore visualization techniques that use data to display information in a more abstract and helpful format so that the data analysis results are better understood. For this case study, we will focus on graphing business data on a map using Altair.
6.7.1. Getting Country Codes from a Web API
Now that you are familiar with graphing data on a map using Altair from the previous case study. We can make use of the provided example in the previous case study to create a graph of the world where the countries are colored by one of the features in the starting a business data set.
In this specific exercise, we will use a web API to get data that maps country codes to country numbers.
We will use the map function to add columns to our starting a business data. This new column will contain country codes.
We can get the information for the new column from different sources. To get this information, we will use a web API from a website. Each website has its specific API format and a protocol to obtain that API. Once we obtained the required data using the web API, we can follow the example from the previous case study to add the new column and then make a world map to show Starting_a_Business_score column from the starting a business data set.
We will use the requests module as it is a great tool that allows us to communicate with databases
across the web. We will also use the restcountries.com, as it provides us an interface where we can get data from their site rather
than a web page. If you recall, there is a way to ask for the data that you want. We will use /v3.1/alpha/XXX.
/rest: Technically, REST stands for REpresentational State Transfer. This uses the HTTP protocol to ask for and respond with data./v2: This is version 2 of this website’s protocol./alpha: This tells the website that the next thing we are going to pass is the country’s three-letter code.XXX: This can be any valid three-letter country code, for example, “usa”.
NOTE there are other ways to look up information, such as the countries’ numericCode, language, currency, and more.
These other methods are in the website restcountries.com.
Open a new tab in your browser and see the call in action. Paste the following
URL in your web browser: https://restcountries.com/v3.1/alpha/usa and make a request.
Let’s also check if our request was processed correctly with status_code. A status code of 200 means everything went fine.
Note
Beware: Content Can Change
Just a quick note to let you know that these web services are like any other software, they go through changes. So while the information we provide here is up to date to the best of our ability, sometimes things change and we may not find out about it. This recently happened with this very data. The URL and host had changed, I don’t know when, but thanks to a long time instructor who emailed me to let me know I have updated this section as of February 2023.
import requests
res = requests.get('https://restcountries.com/v3.1/alpha/usa')
res.status_code
200
We can also look at the text that was returned.
res.text
'[{"name":"United States of America","topLevelDomain":[".us"],"cca2":"US","cca3":"USA","callingCodes":["1"],"capital":"Washington, D.C.","altSpellings":["US","USA","United States of America"],"region":"Americas","subregion":"Northern America","population":323947000,"latlng":[38.0,-97.0],"demonym":"American","area":9629091.0,"gini":48.0,"timezones":["UTC-12:00","UTC-11:00","UTC-10:00","UTC-09:00","UTC-08:00","UTC-07:00","UTC-06:00","UTC-05:00","UTC-04:00","UTC+10:00","UTC+12:00"],"borders":["CAN","MEX"],"nativeName":"United States","ccn3":"840","currencies":[{"code":"USD","name":"United States dollar","symbol":"$"}],"languages":[{"iso639_1":"en","iso639_2":"eng","name":"English","nativeName":"English"}],"translations":{"de":"Vereinigte Staaten von Amerika","es":"Estados Unidos","fr":"États-Unis","ja":"アメリカ合衆国","it":"Stati Uniti D'America","br":"Estados Unidos","pt":"Estados Unidos","nl":"Verenigde Staten","hr":"Sjedinjene Američke Države","fa":"ایالات متحده آمریکا"},"flag":"https://restcountries.com/data/usa.svg","regionalBlocs":[{"acronym":"NAFTA","name":"North American Free Trade Agreement","otherAcronyms":[],"otherNames":["Tratado de Libre Comercio de América del Norte","Accord de Libre-échange Nord-Américain"]}],"cioc":"USA"}]'
If you recall, this long string resembles a Python dictionary. We can convert this string into an actual Python dictionary and then access the individual key-value pairs stored in the dictionary using the usual Python syntax. The official name for the format that we saw above is called JSON. As you recall, JSON is full of dictionaries of dictionaries of lists of dictionaries.
usa_info = res.json()
usa_info
{'name': 'United States of America',
 'topLevelDomain': ['.us'],
 'cca2': 'US',
 'cca3': 'USA',
 'callingCodes': ['1'],
 'capital': 'Washington, D.C.',
 'altSpellings': ['US', 'USA', 'United States of America'],
 'region': 'Americas',
 'subregion': 'Northern America',
 'population': 323947000,
 'latlng': [38.0, -97.0],
 'demonym': 'American',
 'area': 9629091.0,
 'gini': 48.0,
 'timezones': ['UTC-12:00',
   'UTC-11:00',
   'UTC-10:00',
   'UTC-09:00',
   'UTC-08:00',
   'UTC-07:00',
   'UTC-06:00',
   'UTC-05:00',
   'UTC-04:00',
   'UTC+10:00',
   'UTC+12:00'],
 'borders': ['CAN', 'MEX'],
 'nativeName': 'United States',
 'ccn3': '840',
 'currencies': [{'code': 'USD',
   'name': 'United States dollar',
   'symbol': '$'}],
 'languages': [{'iso639_1': 'en',
   'iso639_2': 'eng',
   'name': 'English',
   'nativeName': 'English'}],
 'translations': {'de': 'Vereinigte Staaten von Amerika',
   'es': 'Estados Unidos',
   'fr': 'États-Unis',
   'ja': 'アメリカ合衆国',
   'it': "Stati Uniti D'America",
   'br': 'Estados Unidos',
   'pt': 'Estados Unidos',
   'nl': 'Verenigde Staten',
   'hr': 'Sjedinjene Američke Države',
   'fa': 'ایالات متحده آمریکا'},
 'flag': 'https://restcountries.com/data/usa.svg',
 'regionalBlocs': [{'acronym': 'NAFTA',
   'name': 'North American Free Trade Agreement',
   'otherAcronyms': [],
   'otherNames': ['Tratado de Libre Comercio de América del Norte',
     'Accord de Libre-échange Nord-Américain']}],
 'cioc': 'USA'}
Check Your Understanding
For this example, we will use the starting a business data set and look at the Starting_a_Business_score column in different countries around the world.
wd = pd.read_csv('starting_a_business.csv')
wd.head()
| Location | Code | Starting_a_Business_rank | Starting_a_Business_score | Procedure | Time | Cost | Procedure.1 | Time.1 | Cost.1 | Paid_in_min | Income_Level | GNI | |
|---|---|---|---|---|---|---|---|---|---|---|---|---|---|
| 0 | Afghanistan | AFG | 33 | 92.0 | 4 | 8.0 | 6.8 | 5 | 9.0 | 6.8 | 0.0 | Low income | 550 |
| 1 | Albania | ALB | 34 | 91.8 | 5 | 4.5 | 10.8 | 5 | 4.5 | 10.8 | 0.0 | Upper middle income | 4860 |
| 2 | Algeria | DZA | 98 | 78.0 | 12 | 18.0 | 11.3 | 12 | 18.0 | 11.3 | 0.0 | Upper middle income | 4060 |
| 3 | Angola | AGO | 93 | 79.4 | 8 | 36.0 | 11.1 | 8 | 36.0 | 11.1 | 0.0 | Lower middle income | 3370 |
| 4 | Argentina | ARG | 89 | 80.4 | 12 | 11.5 | 5.0 | 12 | 11.5 | 5.0 | 0.0 | Upper middle income | 12370 |
Since we know how to get additional country information, we can add a new column that contains the numeric code
of each country. We can add this new column in our wd data frame. We can do this by using the map function, which we learned in
the previous case study. If you need to refresh your memory, see here Python Review.
Use df.myColumn.map(function) to map the data. Remember, we don’t pass the
list as a parameter to map since it is a method of a Series.
You have already gone through the process of getting a three-letter country code for the previous case study. We will use the same function to add the country code to the protecting minority investors’ data set. We can use the code below to proceed.
wd['CodeNum'] = wd.Code.map(get_num_code)
wd.head()
| Location | Code | Starting_a_Business_rank | Starting_a_Business_score | Procedure | Time | Cost | Procedure.1 | Time.1 | Cost.1 | Paid_in_min | Income_Level | GNI | CodeNum | |
|---|---|---|---|---|---|---|---|---|---|---|---|---|---|---|
| 0 | Afghanistan | AFG | 33 | 92.0 | 4 | 8.0 | 6.8 | 5 | 9.0 | 6.8 | 0.0 | Low income | 550 | 004 |
| 1 | Albania | ALB | 34 | 91.8 | 5 | 4.5 | 10.8 | 5 | 4.5 | 10.8 | 0.0 | Upper middle income | 4860 | 008 |
| 2 | Algeria | DZA | 98 | 78.0 | 12 | 18.0 | 11.3 | 12 | 18.0 | 11.3 | 0.0 | Upper middle income | 4060 | 012 |
| 3 | Angola | AGO | 93 | 79.4 | 8 | 36.0 | 11.1 | 8 | 36.0 | 11.1 | 0.0 | Lower middle income | 3370 | 024 |
| 4 | Argentina | ARG | 89 | 80.4 | 12 | 11.5 | 5.0 | 12 | 11.5 | 5.0 | 0.0 | Upper middle income | 12370 | 032 |
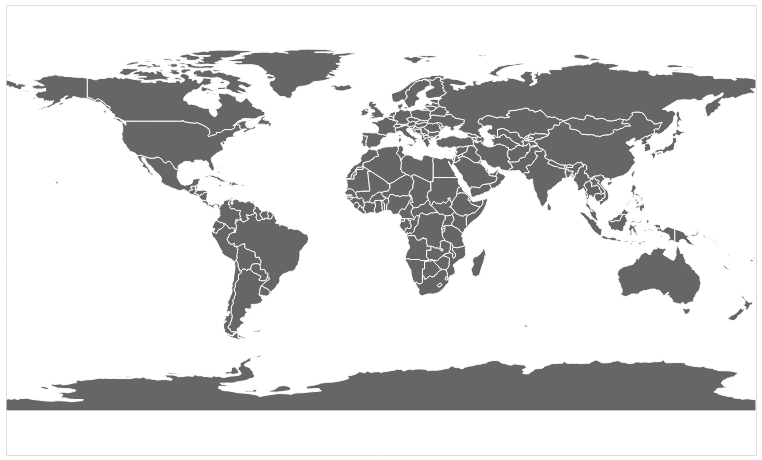
You can make a gray map of the world like this.
countries = alt.topo_feature(data.world_110m.url, 'countries')

  alt.Chart(countries).mark_geoshape(
      fill='#666666',
      stroke='white'
  ).properties(
      width=750,
      height=450
  ).project('equirectangular')
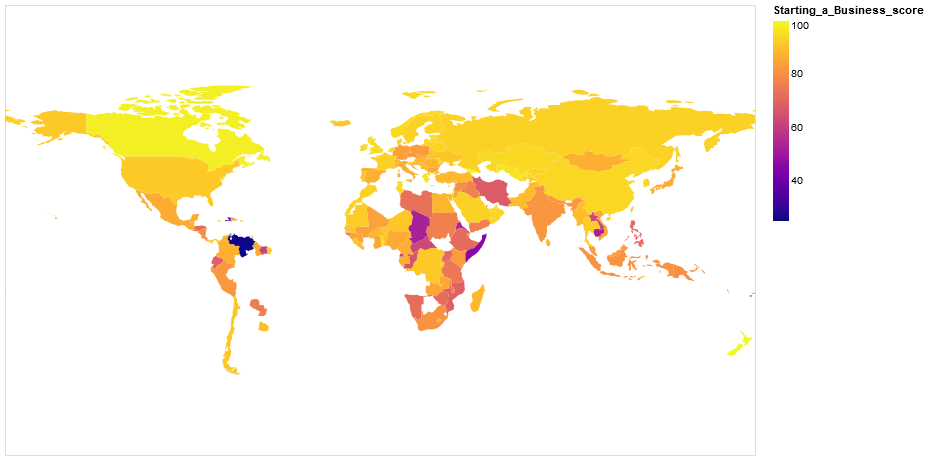
So, now you have the information you need to use the example of the counties above and apply that to the world below.
base = alt.Chart(countries).mark_geoshape(
).encode(tooltip='Country:N',
         color=alt.Color('Starting_a_business score:Q', scale=alt.Scale(scheme="plasma"))
).transform_lookup( # your code here

).properties(
    width=750,
    height=450
).project('equirectangular')

base
Your final result should look like this.
Lesson Feedback
-
During this lesson I was primarily in my...
- 1. Comfort Zone
- 2. Learning Zone
- 3. Panic Zone
-
Completing this lesson took...
- 1. Very little time
- 2. A reasonable amount of time
- 3. More time than is reasonable
-
Based on my own interests and needs, the things taught in this lesson...
- 1. Don't seem worth learning
- 2. May be worth learning
- 3. Are definitely worth learning
-
For me to master the things taught in this lesson feels...
- 1. Definitely within reach
- 2. Within reach if I try my hardest
- 3. Out of reach no matter how hard I try