Preface Vector Calculus Preface
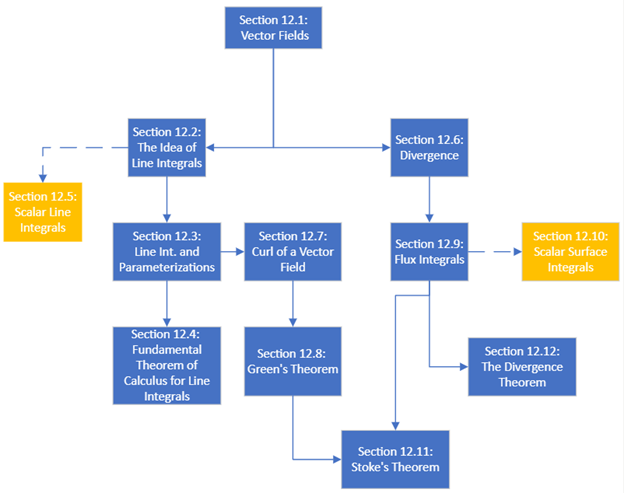
Recognizing that not all institutions will cover all the material in the chapter on vector calculus, we have created the following chart for the depencecies of the topics in Chapter 12.

In this flow chart, the yellow sections are not strictly dependent on the others but use some common arguments that would be helpful for a reader to have seen before working on.
Observant readers may notice that the graphics in Chapter 12 deviate from those in the previous 11. Because so much of vector calculus relies upon visualizing things in three dimensions, we elected to produce almost all of the graphics using SageMath. This allows for a degree of consistency between the two-dimensional graphics, which are typically static, and the three-dimensional graphics, which are almost always interactive. Thus, you can grab a three-dimensional plot, rotate it, zoom in on it, etc.
-
To rotate a three-dimensional graphic, click and drag with your mouse.
-
To zoom on an interactive three-dimensional graphic, use your mouse’s scroll wheel or make your operating system’s scroll gesture on your touchpad.
-
To move a three-dimensional graphic instead of rotating, hold down the space bar while clicking and dragging.
Our Fall 2023 release includes at least some WeBWorK exercises in each of the sections of Chapter 12, but we welcome suggestions of additional WeBWorK exercises that faculty would consider good inclusions and feedback on any aspect of this chapter. The best way to provide feedback is through the Active Calculus - Multivariable Google Group. We will occasionally give some updates through the blog on
Mitchel T. Keller and Nicholas Longhttps://activecalculus.org/.
Madison, Wisconsin and Nacogdoches, Texas
