Example 2.2.1. Finding Revenue From Linear Demand Price.
We have determined that the demand price function for widgets is
\begin{equation*}
\Dprice(q)=10-q/1000\text{,}
\end{equation*}
if the quantity is between 2000 and 8000. Find the revenue function and graph it over the region where it is defined.
Solution.
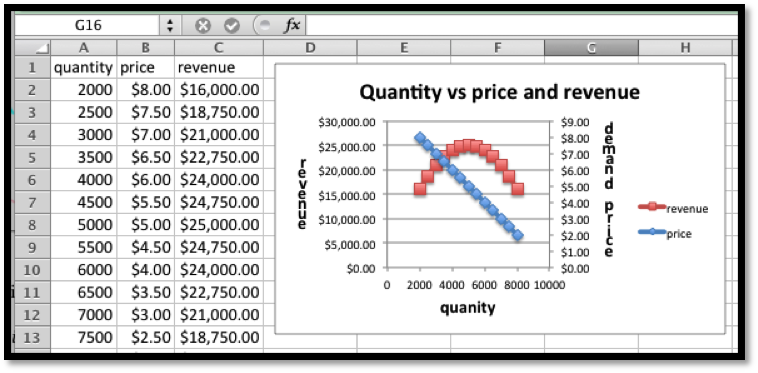
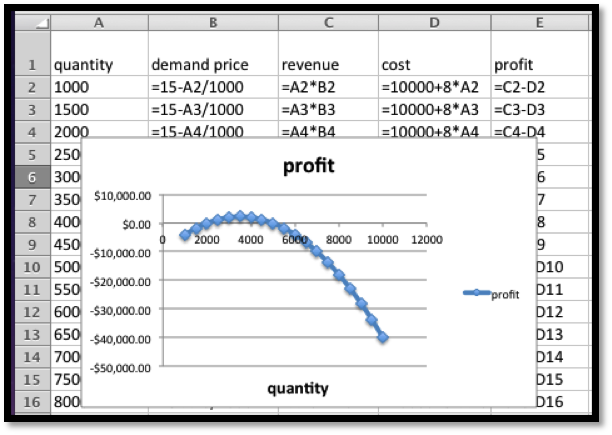
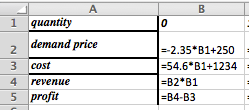
We set up a chart in Excel with revenue defined as \(\Sprice * \quantity\text{.}\)
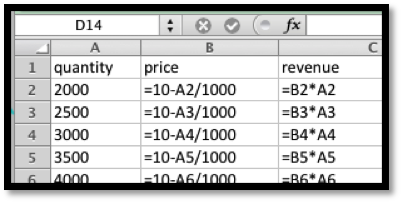
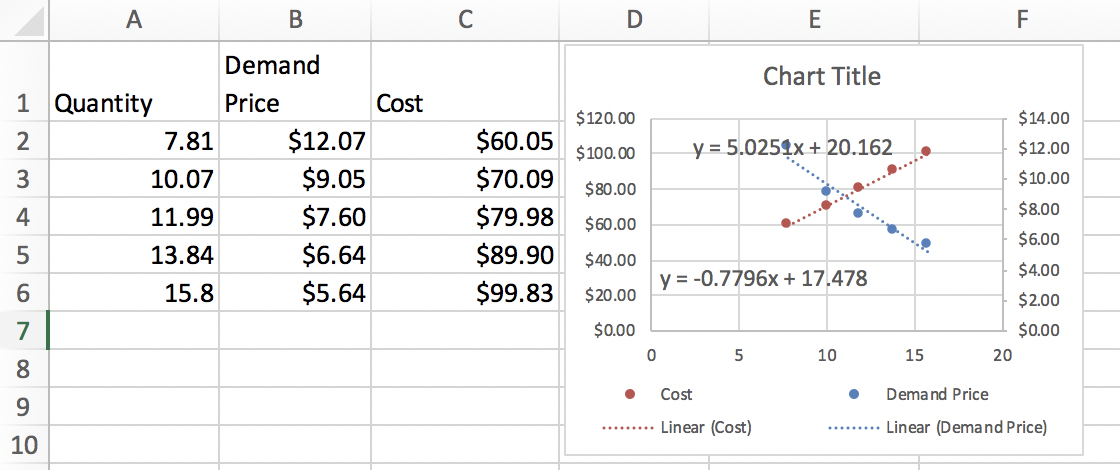
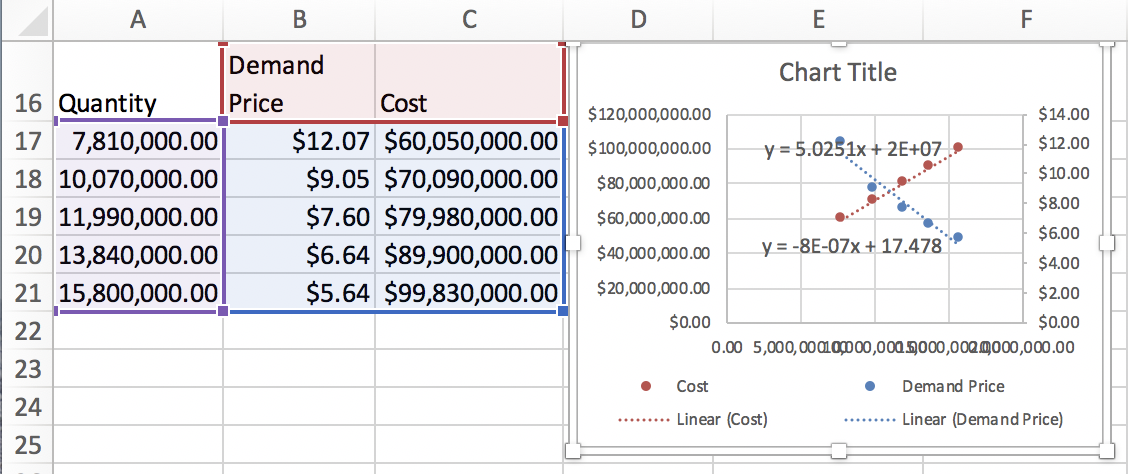
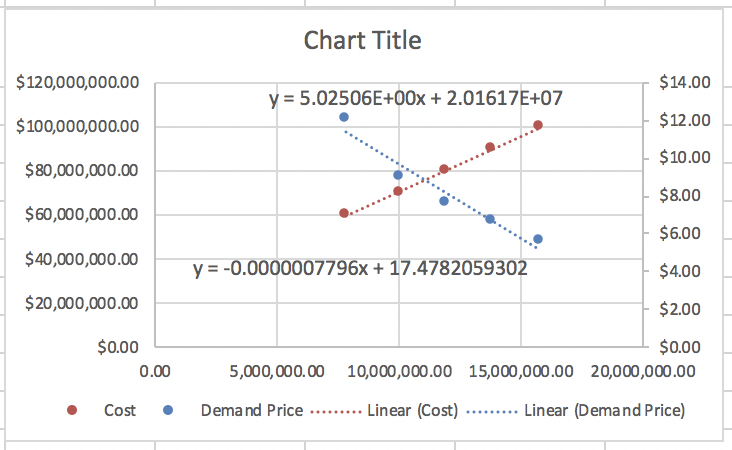
When we graph we note that the scales are quite different for price and revenue. Thus we want to use secondary axes to capture the scale of both price and revenue. We can also put different labels on the two vertical axes.
